
Mount Washington Weather Archives
Monthly F6 Forms: Raw daily weather data (temperature, precipitation, wind, sunshine, sky cover, and weather occurrences) for each month of the year from 2005 to the present, as measured at the Mount Washington Observatory summit weather station.
Normals, Means, and Extremes: Monthly normal average, minimum and maximum weather conditions (temperature, precipitation, snow, hail, ice pellets, and wind speed) as measured at the Mount Washington Observatory summit weather station.
Normal, Means, and Extremes
The following tables provide the “normal” weather conditions on Mount Washington for each month, averaged over the period of 1991-2020. Also included are the extreme (record) conditions recorded during the station’s history, from 1933 to the present.
Note: Values on this page are subject to change without notice.
Temperatures (°F)
| Normal Monthly Average |
Normal Daily Maximum Average |
Normal Daily Minimum Average |
Record High (Year) |
Record Low (Year) |
|
| January | 5.8 | 14.9 | -3.2 | 48 (2013) | -47 (1934) |
| February | 5.9 | 14.8 | -3.0 | 48 (2018) | -47 (2023) |
| March | 12.9 | 20.8 | 4.9 | 54 (1998, 2012) | -38 (1950) |
| April | 23.7 | 30.7 | 16.7 | 60 (1976) | -20 (1995) |
| May | 36.3 | 42.5 | 30.2 | 66 (1977,2020) | -2 (1966) |
| June | 45.5 | 51.4 | 39.6 | 72 (2003) | 8 (1945) |
| July | 49.9 | 55.3 | 44.5 | 71 (1953,2018) | 24 (2001) |
| August | 48.7 | 54.2 | 43.2 | 72 (1975) | 20 (1986) |
| September | 43.1 | 49.1 | 37.1 | 69 (1999) | 9 (1992) |
| October | 31.3 | 37.7 | 24.9 | 62 (2005) | -5 (1939) |
| November | 20.8 | 28.4 | 13.1 | 52 (1982,2019) | -26 (2018) |
| December | 11.8 | 20.1 | 3.5 | 47 (2001) | -46 (1933) |
| Annual | 28.0 | 35.0 | 21.0 | 72 (Aug. 1975) | -47 (Jan. 1934) |
Precipitation (Water Equivalent, Inches)
| Normal Monthly Average |
Record Maximum Monthly Total (Year) |
Record Minimum Monthly Total (Year) |
Record Maximum in 24 Hours (Year) |
|
| January | 5.74 | 18.23 (1958) | 1.29 (1981) | 4.85 (1986) |
| February | 5.45 | 25.56 (1969) | 0.98 (1980) | 10.30 (1970) |
| March | 6.72 | 15.98 (1977) | 2.15 (1946) | 6.45 (1999) |
| April | 7.31 | 15.21 (1988) | 2.19 (1959) | 8.30 (1984) |
| May | 7.68 | 19.00 (1997) | 1.78 (1951) | 4.60 (1967) |
| June | 8.59 | 19.96 (1998) | 2.43 (1979) | 6.50 (1973) |
| July | 8.93 | 17.08 (2023) | 2.69 (1995) | 7.37 (1969) |
| August | 7.72 | 20.69 (1991) | 2.46 (1996) | 6.66 (2011) |
| September | 7.66 | 15.47 (1994) | 2.74 (1948) | 5.38 (1985) |
| October | 9.99 | 28.70 (2005) | 0.75 (1947) | 11.07 (1996) |
| November | 8.09 | 19.56 (1983) | 2.31 (1939) | 6.07 (1968) |
| December | 7.35 | 17.95 (1973) | 1.49 (1955) | 8.64 (1969) |
| Annual | 91.23 | |||
| Record Maximum Yearly Average (Year) | Record Minimum Yearly Average (Year) | |||
| 130.14 (1969) | 71.34 (1979) | |||
Snow, Ice Pellets, Hail (Inches)
| Normal Monthly Average |
Record Maximum Monthly Total (Year) |
Record Maximum in 24 Hours (Year) |
|
| January | 41.4 | 94.6 (1978) | 24.0 (1978) |
| February | 43.3 | 172.8 (1969) | 49.3 (1969) |
| March | 46.2 | 98.0 (1970) | 27.4 (1969) |
| April | 33.1 | 110.9 (1988) | 27.2 (1988) |
| May | 12.9 | 95.8 (1997) | 22.2 (1967) |
| June | 1.3 | 8.1 (1959) | 5.1 (1988) |
| July | 0.0 | 1.1 (1957) | 1.1 (1957) |
| August | 0.1 | 2.5 (1965) | 2.5 (1965) |
| September | 1.2 | 7.8 (1949) | 7.7 (1986) |
| October | 19.0 | 78.9 (2005) | 25.7 (2005) |
| November | 35.6 | 86.6 (1968) | 25.0 (1968) |
| December | 47.7 | 103.7 (1968) | 37.5 (1968) |
| Annual | 281.8 | ||
| Record Maximum Seasonal Total (Year) | |||
| 566.4 (1968-69) | |||
Wind (MPH)
| Normal Monthly Average Speed |
Normal Monthly Average Direction |
Record Peak Gust Direction (Year) |
|
| January | 45.6 | W | 172 – NW (1985) |
| February | 44.6 | W | 171 – W (2019) |
| March | 39.8 | W | 180 – W(1942) |
| April | 35.6 | W | 231 – SE (1934) |
| May | 29.6 | W | 164 – W (1945) |
| June | 26.8 | W | 136 – NW (1941) |
| July | 25.5 | W | 154 – W (1996) |
| August | 24.5 | W | 147 – SE (2020) |
| September | 27.6 | W | 174 – SE (1979) |
| October | 35.5 | W | 161 – W (1943) |
| November | 39.4 | W | 163 – NW (1983) |
| December | 44.0 | W | 178 – NW(1980) |
| Annual | 34.9 | W | 231 – SE (1934) |
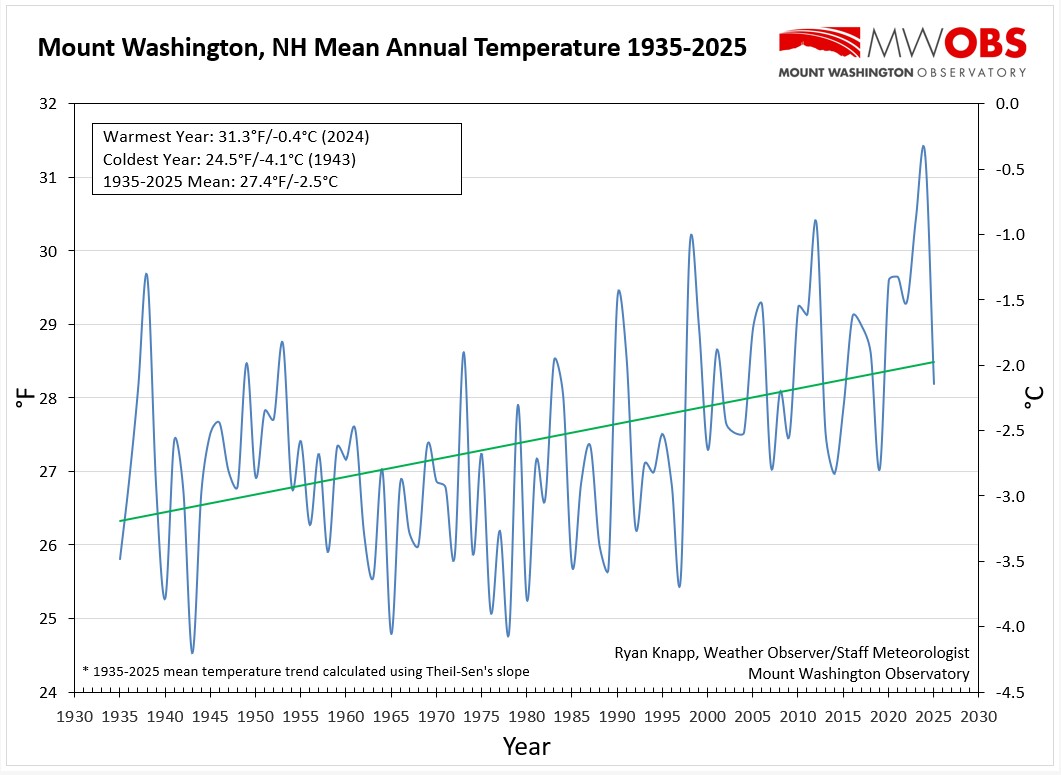
Climate 1935-Present: A graph of mean temperatures during these years.
NCON 3 Weather Summaries : Weather summaries from our NWS Co-op station located in North Conway New Hampshire.
North Conway, NH (NCON3)
Managed by Mount Washington Observatory Staff & Volunteers
BACKGROUND & HISTORY
This station, known as NCON3, is one of more than 8,000 weather monitoring sites in the country that are operated by volunteers in the National Weather Service (NWS) Cooperative Observer Program (Coop). The mission of the Coop program, according to NWS is:
- To provide observational meteorological data, usually consisting of daily maximum and minimum temperatures, snowfall, and 24-hour precipitation totals, required to define the climate of the United States and to help measure long-term climate changes.
- To provide observational meteorological data in near real-time to support forecast, warning and other public service programs of the NWS.Daily CooP observations began in North Conway in 1959 by Joe Dodge, one of the founders of Mount Washington Observatory, at his home on West Side Road. Briggs Bunker followed Dodge making daily observations a short distance away on Pine Street, from 1974 until 2006. Ed Bergeron continued making daily observations at his home on West Side Road until October 2015 when this station was commissioned on October 7, 2015. Now observations of rain, snow and temperature as well as visibility, sky cover and ground conditions are made every morning at 8:00 AM, 365 days a year by MWO staff and volunteers. If you are interested in becoming a volunteer at this station, or simply want to learn more, please contact education@mountwashington.org
MONTHLY SUMMARIES
Read the latest monthly summaries from this station to learn about the weather and climate in the Mount Washington Valley:
2020:
April May June July August September October November December
